
MAINTENANCE ANALYTICS
stop Logging Maintenance.
Start managing it.
Metrix turns your existing maintenance data into live analytics that show where to focus your time: KPIs, target completion rates, contractor bottlenecks and backlog trends, with automated reports sent to the people who need them.
Less Admin
Better visibility
Greater accountability
THE CHALLENGE
You have the data. But do you know what it’s telling you?
Traditional maintenance systems are good at logging jobs, not analysing performance. So the important questions become hard to answer.

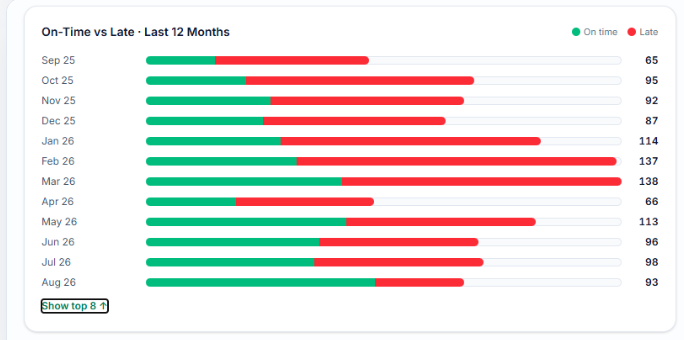
Is the backlog getting better or worse?

Which projects are causing the most problems?

Which contractors perform best and worst?

Where is your team’s time being spent?

How long are jobs remaining unresolved?
Without that visibility, maintenance becomes reactive rather than managed.
THE DASHBOARD
One dashboard. The full picture.
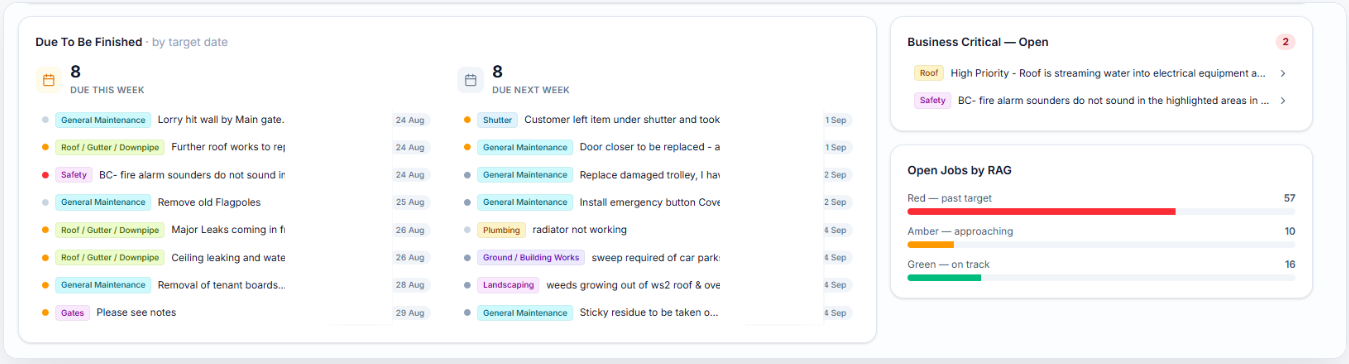
Metrix connects to the maintenance data you already have and turns it into a clear, portfolio-wide view of performance.
Are we getting on top of maintenance, and where do we need to intervene?
- Site performance
- Contractor performance
- Workloads and trends

AUTOMATED REPORTING
Your reports. Sent automatically.
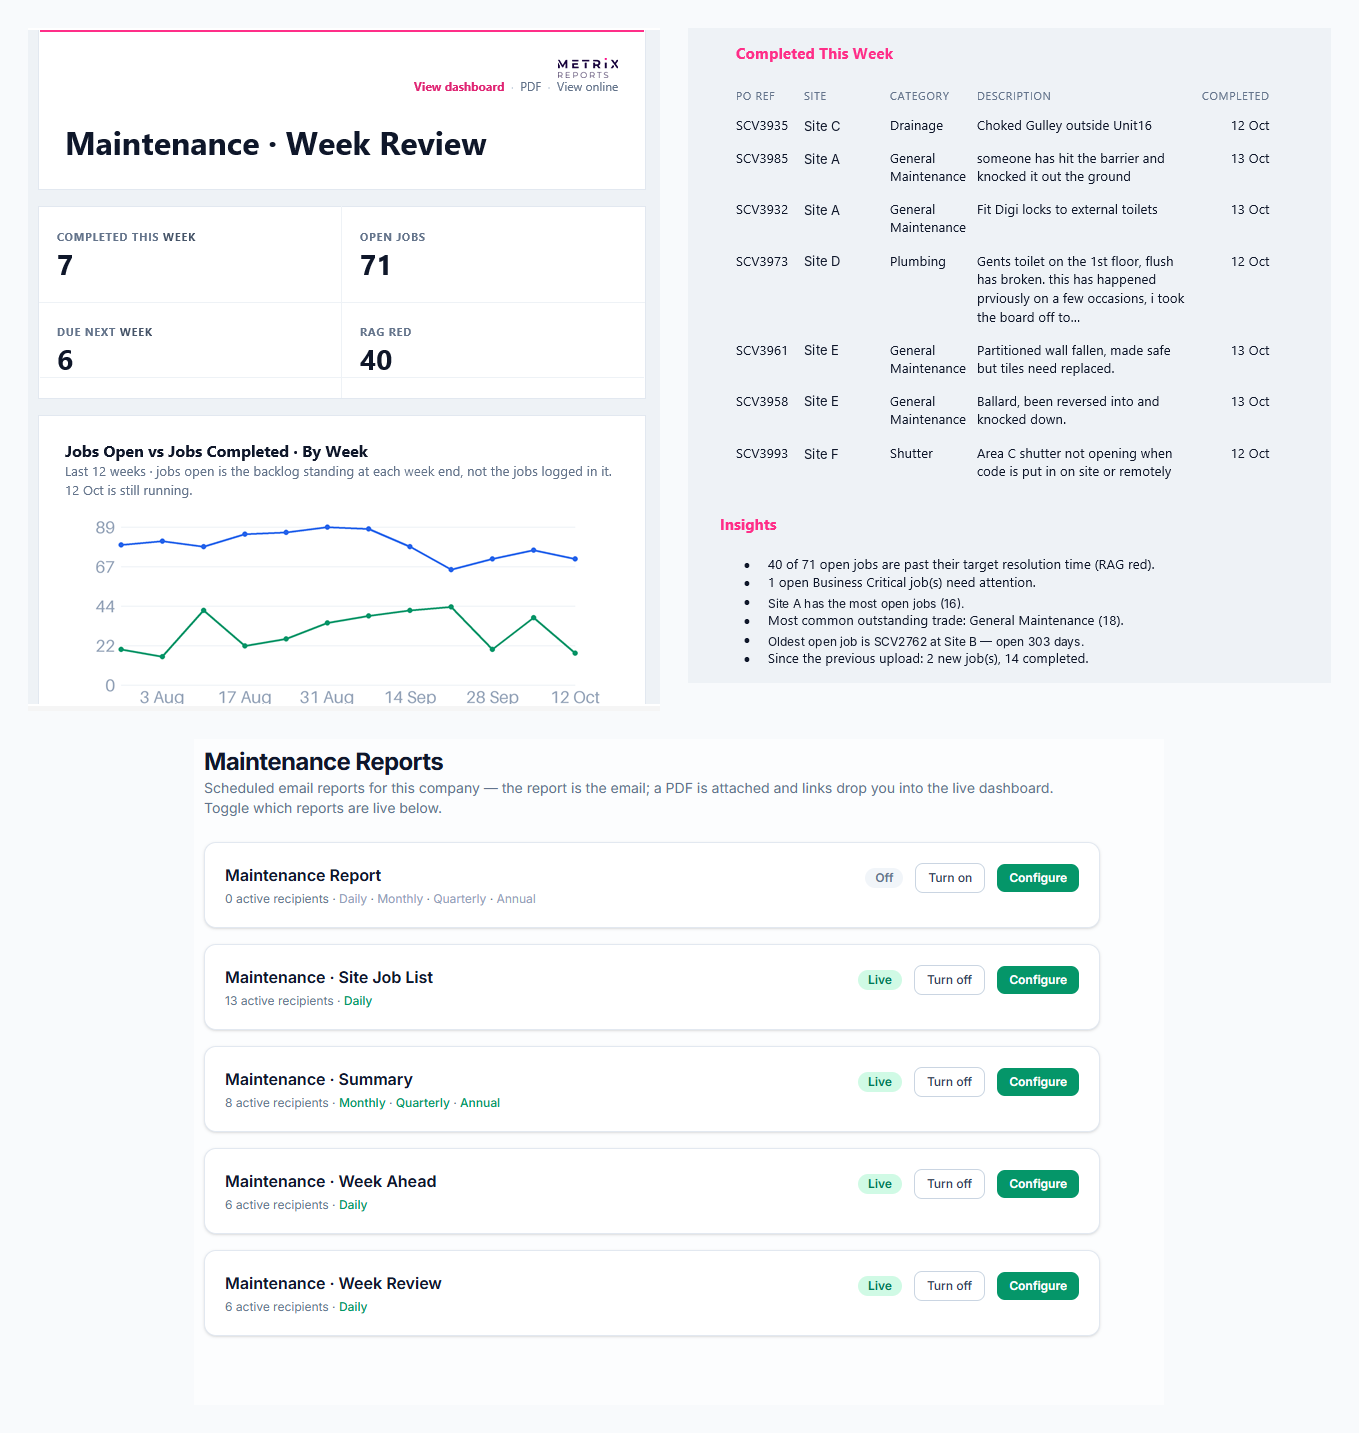
The dashboard is only part of the solution. Metrix also creates and emails your maintenance reports, so everyone knows what’s happening, what’s expected and what they’re responsible for.
Weekly Review
What happened last week and what needs attention.
Week Ahead
Upcoming jobs, scheduled works and priorities.
Monthly Performance
Trends, backlog and contractor and site performance.
Site Reports
Each location receives its upcoming maintenance schedule.
Contractor Reports
Each contractor receives their assigned jobs and scheduled dates.
CONTRACTOR PERFORMANCE
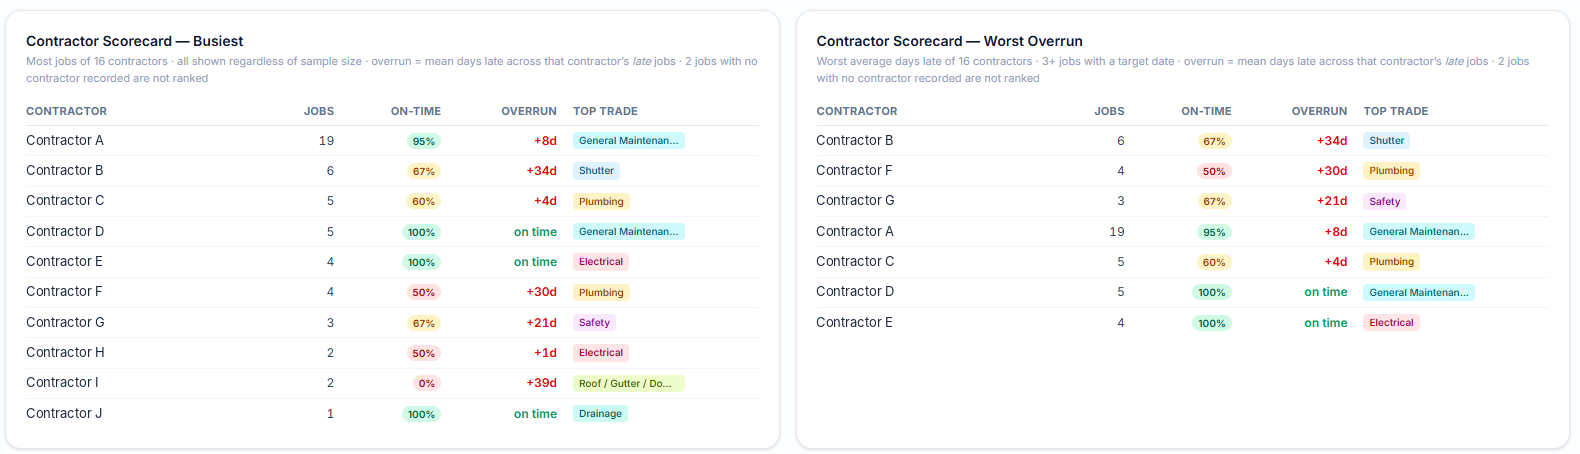
Make contractor performance measurable.
Who’s performing well? Who isn’t? Metrix creates contractor scorecards automatically, so you compare performance on real data rather than anecdotal feedback. Jobs completed, outstanding work, completion times, overdue jobs and trends.
Our Process
tell Us the problem
Show us the process, task, data or challenge you want to improve
We’ll find the opportunity
We’ll work with you to understand what can be automated, analysed and improved
We Build It
Our team designs and develops a bespoke tool around your business and existing systems
You use it
A practical, working tool designed to save time, uncover information or help your business perform better
We keep improving it
As your business changes, your tool can change with it
WORKLOAD ANALYSIS
Know where your time is going.
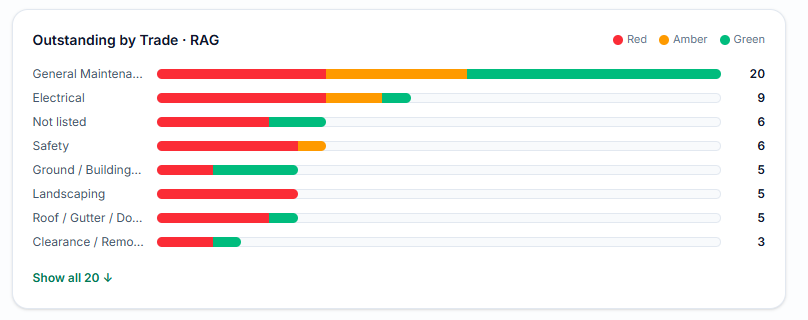
See exactly where maintenance resource is being consumed across your business. Analyse workloads by site, contractor, priority, category and job status to identify problem locations and allocate resources more effectively.
CASE STUDY
From 4+ hours of reporting every week, to zero.
Before Metrix, the Storage Vault team spent around 3 to 4 hours every week manually producing maintenance reports. Now the data updates, the analysis happens, the reports are created and the emails are sent. Automatically.
WHAT CHANGES
Better visibility
See the whole maintenance operation in one place.
Greater accountability
Measure contractor and team performance.
Less admin
Remove hours of manual reporting.
Earlier intervention
Identify problems before they become expensive.
Better communication
Keep management, sites and contractors informed automatically.
Better decisions
Use real data to reduce backlogs and unnecessary spend.